Introduction
How front pages of newspapers became more visual.
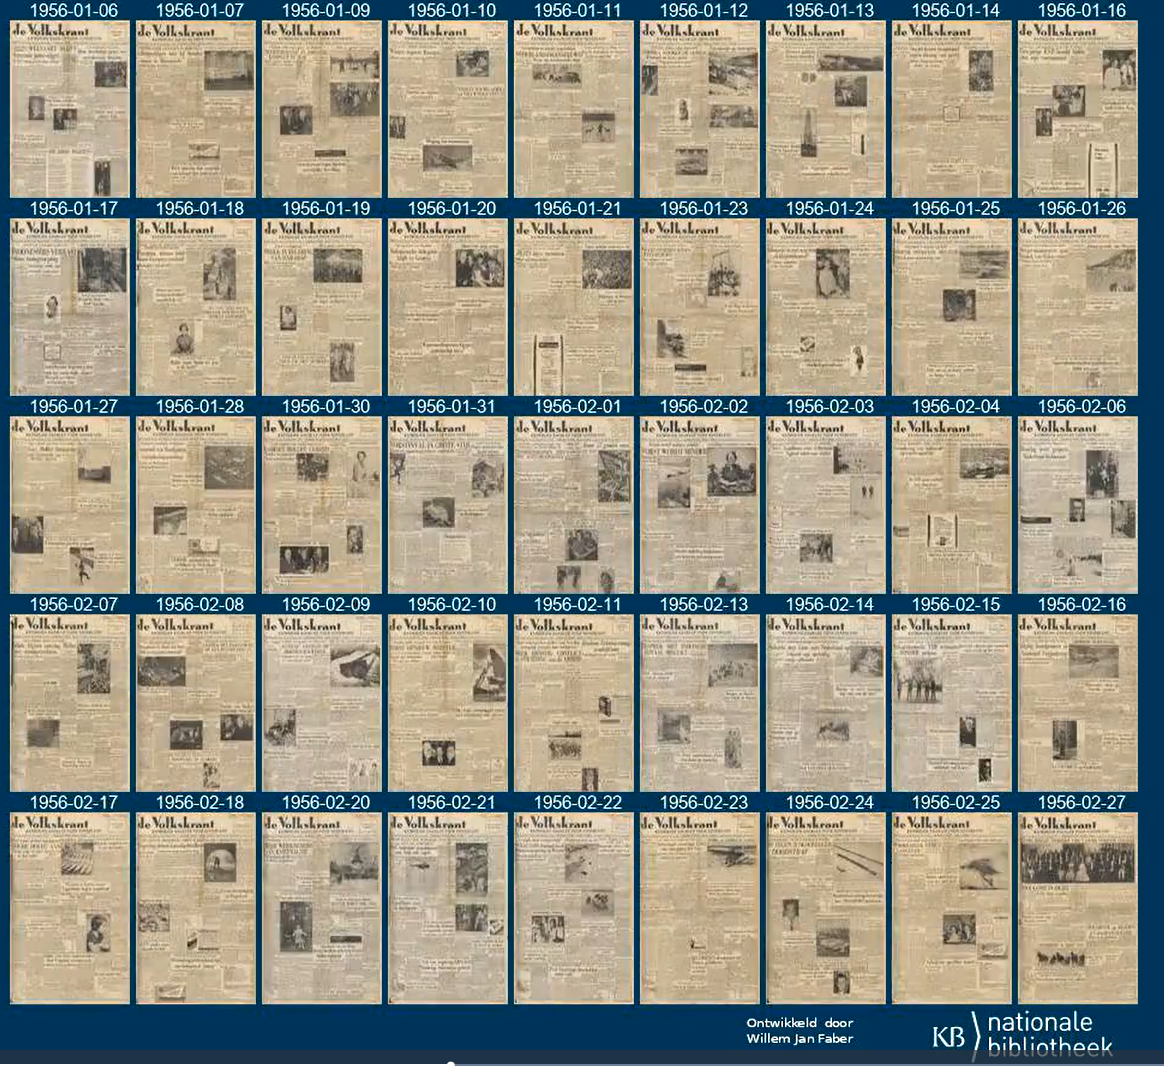
To view a hundred years' worth of newspapers within a minute? It is possible! The KB visualized three newspapers from its digital collection: de Volkskrant, de Telegraaf and NRC Handelsblad. You can view the animations on the Live demo page (see the tab on the top of this page) or visit the Dutch Timelapse page.
The timelapse animations show a development that everyone knows of, but nobody witnessed in real-time: the rise of images in our news feeds. KB researcher Willem Jan Faber made the animations after he and his colleagues got inspired after watching this NY-Times video made by data-artist Josh Begley.
Get started yourself with KB-data
For those that wonder how these animations, showing newspapers that the KB digitized, were made: we used opensource tools. The programming language that was used was Python, to be specific the Python Imaging Library (PIL), and to connect all separate images Magick image converter was used. Because the tools are open source people who are tech savvy can use this as well when you work with KB data.
Possible KB-sources
But which KB-sources can you use? The KB makes digitized newspapers, magazines and books available on Delpher and DBNL. Moreover, there is a special service for customers that wish to work with KB data: dataservices. A large part of the KB digitized collection is under copyright protection and can only be used under certain conditions: for example for scientific research. However, the KB's open data collections can be used by everyone. For more information visit the dataservices webpage. For examples how researchers have used KB-collections look around this website: on the tool and dataset pages.
De Telegraaf
De Volkskrant
NRC Handelsblad
When citing this tool we request you cite it as follows:
Faber, W.J. (2021) Timelapse. KB Lab: The Hague. https://lab.kb.nl/tool/timelapse