Introduction
Update 2 October 2025: the live demo and the Dutch demo site are no longer supported by the KB Lab and have been removed.
Description
This Dutch demo site was produced to give an idea of the possibilities of showcasing digital heritage collections. We dive into the history of pandemic reporting in Dutch newspapers. There are four categories from which you can start. Each category will take you to a timeline where you can choose a year. For each year you can discover more about related subjects and connections. For those interested, the data and code has been made available as a starting point for anyone who wants to create a similar site or visualisations (see ‘Instructions’).
Data
The data that was used for this project comes from the Dutch digital heritage website Delpher.nl. Delpher has been developed by four university libraries. It contains Dutch historical texts from libraries, scientific institutions and digital heritage institutions. The user can search through millions of digitized pages from books, newspapers and periodicals. For this demo website, the data from the newspaper archive was used.
Usage
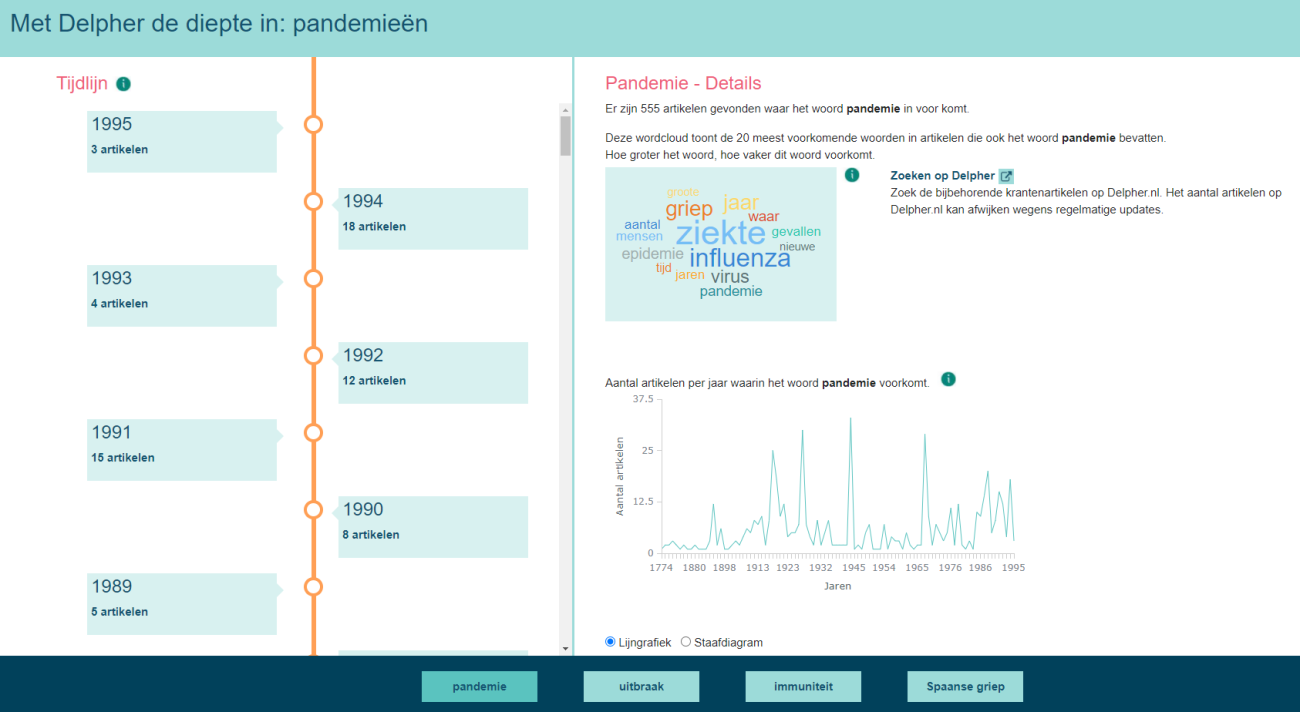
You can click around on the site to discover more about pandemics in the past three centuries. For each year, pre-defined keywords can be selected. For every selection, a wordcloud, a wordtree and a bar chart are created. You can also read the articles on Delpher or download a csv file of the selection to experiment with your own analysis.
When citing this tool we request you cite it as follows:
M. Cuper, (2021) Met Delpher de diepte in: pandemieën. KB Lab: The Hague. https://lab.kb.nl/tool/delpher-demo-pandemics-through-time-dutch
Instructions
Together with this demo site, a Github repository was created with two types of code that can be used for further research or other usage.
Jupyter Notebooks
There are two Jupyter Notebooks available. They contain walk-throughs for preparing and visualising the data. These Notebooks are designed for researchers or others who are interested and have little or no experience in coding. They give a quick start for coding with Python. Based on data samples that were used for the site, you learn how to prepare the data by creating, for example, a bag of words and how to make simple figures like a histogram, bar chart and a wordcloud.
Source code
For those who already have coding experience and want to develop a site similar to the demo site, the source code of the site, including an example database, has been made available. The used languages are HTML, CSS, PHP and Javascript.