My pre-processing approach shows some flaws. Also: can I compare websites with Social Media platforms?
Introduction
As a now 29 year old researcher I have limited memories of the early internet. I remember calling in through the phone line, using good old MSN to chat with friends after school and visiting the odd website. But my first extensive interaction with the internet was through a Dutch Social Media platform called Hyves. It started on 22 September 2004 and ended on the 2nd of December 2013 (though it did continue as a game platform called Hyves Games). This was partly because international rival Facebook got popular from 2010 onward. So when I started out I was excited to discover what I could learn about this platform, its growth and decline, through this research project. But when I made my final visualisations I was shocked to discover I could barely find any reference to the platform in any of the years. There were almost no Hyves nodes visible!
|
Explanation visualisations: Read more about visualisations and their terminology in general, how I made these visualisations, their consistency and how I marked all the nodes in my third blogpost about Gephi. Red nodes are source websites on which URLs were found. Green nodes are URLs that were only found. Blue text are nodes which are marked manually as Social Media. I have not marked all Social Media, just a selection. Regarding the year 2010 I unfortunately made a consistency error because I had neglected to mark Vimeo as Social Media. In the other visualisations however I did mark it as such. |
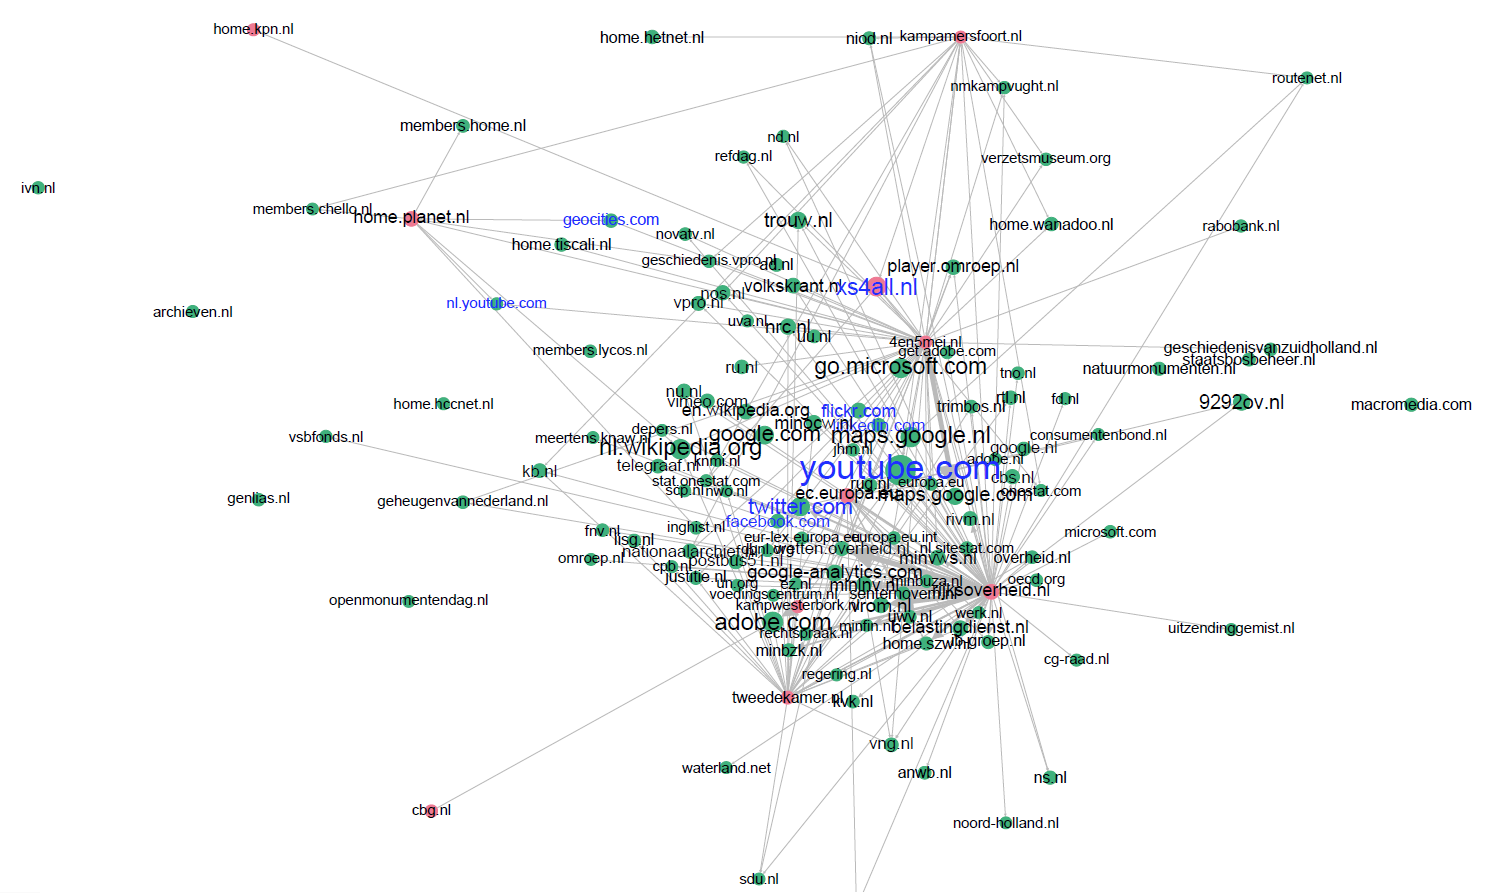
Figure 1: In the final visualisation of September 2010 (indegree 20+), Hyves is nowhere to be seen.
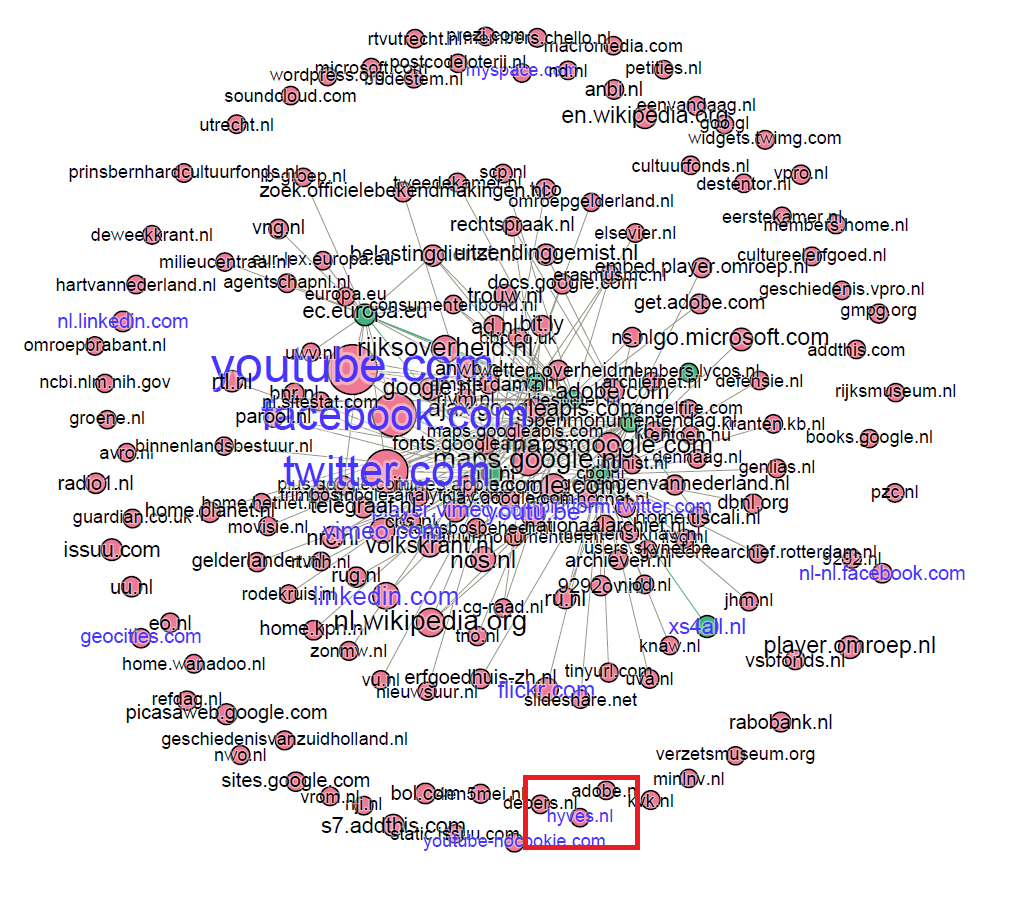
Figure 2: Final visualisation September 2013 (indegree 20+): Hyves is just a little disjointed node on the edge of the graph.
Finding Hyves
Because Hyves was absent or just a little footnote in the visualisations, I performed a quick keyword search in two datasets for each of the years. The first dataset was the one I imported into Gephi. The second one was the dataset I exported from Gephi containing all edges with an indegree of 10 or more (the visualisations show nodes with an indegree of 20 or more). I simply searched for URLs relating to the Social Media platforms as mentioned in the tables (without also looking for variants such as youtu.be).
| Gephi export file - indegree 10+ | 2010 | 2013 | 2016 | 2019 |
|---|---|---|---|---|
| 9 | 21 | 32 | 108 | |
| Hyves | 5 | 2 | 0 | 1 |
| YouTube | 26 | 24 | 33 | 90 |
| Gephi import file | 2010 | 2013 | 2016 | 2019 |
|---|---|---|---|---|
| 48 | 418 | 678 | 1.140 | |
| Hyves | 210 | 234 | 118 | 210 |
| YouTube | 226 | 488 | 609 | 909 |
So in the exported dataset Hyves was indeed barely present, as was the case in de visualisations. But in the original import file I discovered Hyves had a significant presence. Especially in 2010 where I found more URLs relating to Hyves than to Facebook. Why did this not translate into the visualisation? It did not take long to find the answer. The cause was the way the hyperlink was built. If we look at a Facebook account link it goes like this: facebook.com/account. With Hyves the hyperlink is built as follows: account.hyves.nl. The Hyves extension thus becomes a subdomain. When I pre-processed the data, the Facebook links all became ‘facebook.com’, as the account part was cut off. All the Hyves links remained account.hyves.nl. When visualizing this in Gephi this caused Facebook becoming one big node (with many other nodes pointing to it), while Hyves was divided into many little nodes each with a low indegree. When filtered, these nodes therefore disappeared from the visualisation.
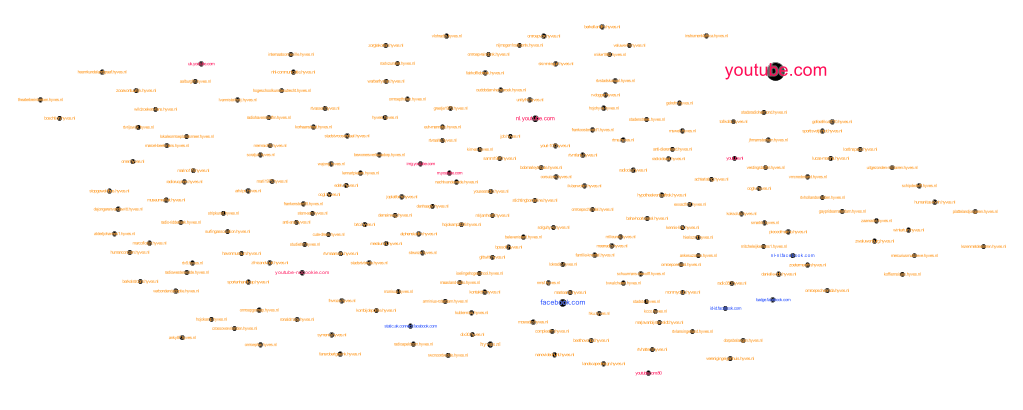
Figure 3: Visualisation of all Hyves (orange), Facebook (blue) and YouTube (red) nodes in 2010. Hyves has lots of unique little nodes while YouTube and Facebook are all fairly consistent.
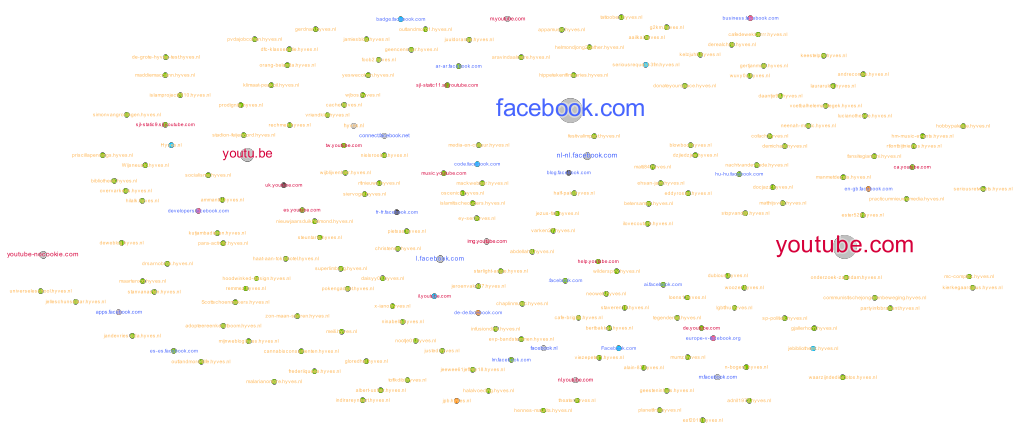
Figure 4: Visualisation of all Hyves, Facebook and YouTube nodes in 2019. Facebook and YouTube links are still fairly consistent but also get more diverse.
Now that I knew this was a problem, I looked into other Social Media platforms. Most notable other platforms that had the same problem were Blogspot (a content management system for blogs from Google) and Tumblr (a microblogging website). In the visualisations they are both non-existent, but when looking into the data from the Gephi import file, both are very present. At a certain point these are even bigger than Facebook, YouTube and Hyves put together! Both have hyperlinks similarly constructed as Hyves, with their platform’s name becoming a subdomain.
| Gephi export file - indegree 10+ | 2010 | 2013 | 2016 | 2019 |
|---|---|---|---|---|
| Blogspot | 0 | 0 | 0 | 12 |
| Tumblr | 0 | 0 | 0 | 2 |
| Gephi import file | 2010 | 2013 | 2016 | 2019 |
|---|---|---|---|---|
| Blogspot | 367 | 620 | 1.427 | 6.273 |
| Tumblr | 3 | 159 | 232 | 11.524 |
Apples and oranges
So, I concluded, my pre-processing process showed some flaws. The way I cropped my hyperlinks lead to certain platforms with ‘consistent’ hyperlinks to be favoured above others. The solution could be simple: build in another step and cut down hyperlinks, converting account.hyves.nl into hyves.nl to create a level playing field. I wondered however: would that really level the playing field? My visualisations also included regular websites. Would it really be fair to compare regular websites with big hive-like platforms such as Blogspot, Facebook and Hyves? Can you compare platforms consisting out of many (little) unique and unrelated (micro)blogs with blogs that have their own separate URL? Are Social Media platforms even ‘websites’ or are the different accounts the ‘websites’?
Leading web archive researcher Niels Brügger describes a ‘website’, the third of his five web stratums as follows:
“On the hidden level, the third web stratum—the website—is constituted by whatever code element supports the coherence of the web pages across the website, such as the web domain name, a general template, a content management system (CMS), blog software, and the like. On the code level, the coherence of the website is supported mainly by these features, in combination with actually expressed hyperlinks to other web pages on the website, and thus the website is delimited by these means.”¹
Brügger’s next stratum is the web sphere, where domains such as Blogspot and Hyves could be a part of based on their subdomain-hyperlink structure:
“The web sphere, the fourth web stratum, must be constituted by something that may be used to delimit the event, concept, theme, or geographic area on the code level. This may include any type of body text, a set of URLs, a top-level domain name (e.g., a country-code top-level domain (ccTLD) such as .uk, .fr, .dk, or a generic top-level domain (gTLD) such as .com, .gov), a subdomain name (e.g., .gov.uk, .ac.uk), or the web sphere may be created by the use of outgoing hyperlinks to find relevant members to include in the web sphere. Thus, a code-level study of the web sphere may involve all the above components, only one, or combinations.”²
In The Archived Web both GeoCities and Facebook are named as examples of researching a website stratum.³ But according to the definition of the web sphere, it could be that as well.
In the end, I think, it probably depends on the research question whether you want to analyse the platforms as websites or web spheres. For example, I had two goals for this blog series:
- Getting insight in the kinds of Social Media that are present in the web collection to get an idea what the gaps in the collection are (as Social Media is not being harvested).
- Analysing the historical growth of Social Media within the KB web collection narrowed down to specific years and months.
For both research questions I needed to be able compare different Social Media platforms. At the moment comparing them is hard because one category is now analysed as one platform (Facebook and YouTube) and the other as separate websites (Hyves, Blogspot, Tumblr).
So for future research either I need to cut the Hyves-type hyperlinks down to Facebook format, or I have to extent the Facebook-type links back to Hyves format (facebook.com/account). Either approach should be fine, as long as they are all based on either website level or web sphere level. This way they are comparable and I can analyse the historical growth of the platforms or (for example) the number of unique accounts.
Though both solutions are possible, for getting insight in the kind of Social Media that is present in the web collection I would slightly prefer account/website level. Firstly because the KB has a selective web collection. We harvest individual websites or URLs and not whole web spheres. So if searching for gaps in the web collection, account/website level would be the way to go. This would also tie in with the current selection as we, for example, already archive 190 Blogspot websites (March 2022). The second reason is because I suspect that (for example) my Facebook node probably consists of hyperlinks that point to many different kinds of resources. They are not only account pages, but also logo images or login pages. When researching what is missing in the web collection I need to understand what it is these links refer to. For this I need hyperlinks that not only refer to the top level domain, but also to ‘resource’ level such as an account or an image.
Be aware
I would like to conclude with some lessons I learned through this little subcase:
1. Avoid black boxes.
When creating a visualisation on your own, using a tool to create a visualisation or even just looking at a visualisation someone made for you: always ask (or explain) how the pre-processing took place. You do not need to know all the details, but you do need to understand the main steps that were taken and choices which were made. Be critical! This way you avoid the tool or method being a black box: were you put some data in, something unclears happens and the visualisation appears without you understanding what happened or what data you are missing.
2. Fit your visualisation to your research question.
I do not think there is one good way to make a visualisation or to crop hyperlinks. But I do believe in thinking about it carefully, making a conscious choice and following it through as consistent as practically possible.
3. Be careful when comparing apples and oranges.
This ties in with the previous step, but I wanted to mention it separately. On the internet there are lots of sources that look similar, but are also slightly different. Make sure you think about definitions and types of sources carefully before and during your research to avoid unbalanced equations. And if you do compare apples and oranges, be conscious about it and explain why you are doing it.
The plot thickens…
This case raised several other questions that I have not answered here, but will in the upcoming posts:
- How can we define what is Social Media?
In this post I just assumed Hyves, Blogspot and Tumblr are Social Media just like Facebook and YouTube. But are they really?
- My data contains a lot of different kinds of hyperlinks. Am I not comparing apples and oranges (again)?
I briefly touched upon this by mentioning that the Facebook node probably consists of hyperlinks that point to many different kinds of resources. This was presumably caused by the original extracting of the hyperlinks from the WARCs at the start of this research project. We extracted lots of different kinds of hyperlinks (read part 1): Anchor links with a href tag (<a>, <link>, <area>) but also embedded links without href tag (<img>, <script>, <embed>, <source>, <frame>, <iframe> and <track>). Hyperlinks were also extracted from all parts of the websites (paragraphs, footers, sidebars etc.). The result is that I had a lot of data to create lovely grand visualisations. But on the other side all these diverse data were cobbled together into one dataset with no way to differentiate them into different groups. Now I am doubting whether this was a good idea.
To be continued…
p.s. My wonderful workmate always checks my English for me. This time he corrected one of the paragraph titles as in the Netherlands we compare our apples with pears instead of oranges. I feel like there is a lesson to be learned here about knowing the peculiarities of one’s national web sphere. But for now, I just want to say thanks for all the pear reviews!
Notes
[1] Brügger, N., The Archived Web. Doing history in the digital age (London 2018) p.37.
[2] Brügger, The Archived Web, p.37.
[3] Brügger, The Archived Web, p.58 and p. 68.

Related
Previous: Working with Gephi - Link analysis part 3
Next: coming soon...
Glossary
Anchor link – for our research these are hyperlinks with a href tag (<a>, <link>, <area>)
Embedded link – for our research these are hyperlinks without href tag (<img>, <script>, <embed>, <source>, <frame>, <iframe> and <track>)
HeidiSQL - lets you see and edit data and structures from computers running one of the database systems MariaDB, MySQL, Microsoft SQL, PostgreSQL and SQLite. For our research we use MariaDB.
Gephi - a visualization and exploration tool for all kinds of graphs and networks. Gephi is open-source and free.
MariaDB - a relational database made by the original developers of MySQL, open source.
Target Record (or Target) – Contains overarching settings such as schedule frequency (when and how often a website is harvested) and basic metadata like a subjectcode or a collection label.
Target Instance - is created each time a Target Record instructs Heritrix to harvest a website. Contains information about the result of the harvest and the log files.
WARC – file type in which archived websites are stored. The KB archive consists of WARC and its predecessor ARC files. This project was done for both types of files.
WCT – Web Curator Tool is a tool for managing selective web harvesting for non-technical users.
Web collection – For the KB: they have a selective web archiving policy were they harvest a limited number of sites. You can find an overview of all archived websites at the KB on their FAQ page [Dutch].