While researching the geographic dimension of news, I have collected quite a large amount of data on cities and how they are mentioned in historical newspapers. While my primary interest is the circulation of information through local newspapers before the Second World War (when the written press was the main source of non-local information), together with Willem Jan Faber, we have also collected data for national newspapers in order to make the dataset relevant for other people interested in the geographical dimension of Dutch historical newspapers.
Introduction
In this blogpost, I propose to give an example of what kind of analysis will be possible with the dataset I created and that will be released soon. I apply simple methods to map and analyse the long term coverage of Dutch cities in one of the biggest Dutch national newspapers: De Volkskrant. The workflow have been made with R, a programming language designed for statistics and data science. The code is available on my github [1]. All the datasets that are used in this example are open and can be downloaded from the following sources:
- GeoNewsNL, the data on media coverage of Dutch cities was created during my period of researcher-in-residence at the Koninklijke Bibliotheek; a small piece of this dataset with info on De Volkskrant will be released soon on my github [2]
- The geometries of the municipalities comes from the NLGIS website and are accessed through its API. This website is the result of a project of Richard Zijdeman, Jerry de Vries and Vyacheslav Tykhonov from the International Institute of Social History [3]
- The population data can be found on the EASY dataverse, it has been created by Ashkpour, A. from the International Institute of Social History [4]
GeoNewsNL is structured the following way:
| PPN | CITY | YEAR | TYPE | FREQ |
| 412869594 | Aalsmeer | 1955 | advertentie | 43 |
| 412869594 | Aalsmeer | 1955 | artikel | 65 |
| 412869594 | Aalsmeer | 1955 | familiebericht | 3 |
The column PPN corresponds to a unique identifier given to each newspaper title, here the number is the one attached to De Volkskrant. CITY is a character string corresponding to the city that is mentioned. We collected data for about 300 individual settlements. YEAR indicates the date. TYPE describes whether the city is mentioned in an article, an advertisement, some family announcements, or in the caption of an illustration. Finally, FREQ indicates the number of times the city was mentioned according to this combination of variables. For example, the first line of the table shows that Aalsmeer was mentioned in 43 advertisments that occurred in De Volkskrant in 1955.
Visualising the data
For a first visualisation, I aggregated the types of news items for periods of ten years. The information on the frequency by which the different cities were mentioned is spatialized with a file also available on my github with x and y coordinates of each of the settlements. As the number of news items is not the same between the different periods, I have computed a relative frequency index by dividing the frequency of mention by the total amount of news items published during the period, which was then multiplied by 100. For the first map of the Figure 1 bellow, the size of Amsterdam corresponds to 20.57, which means that Amsterdam appears in a bit more than 20 % of the news items at this period. The sum of all these relative frequencies of the cities during one period is not equal to 100 as a single news item can mention several cities.
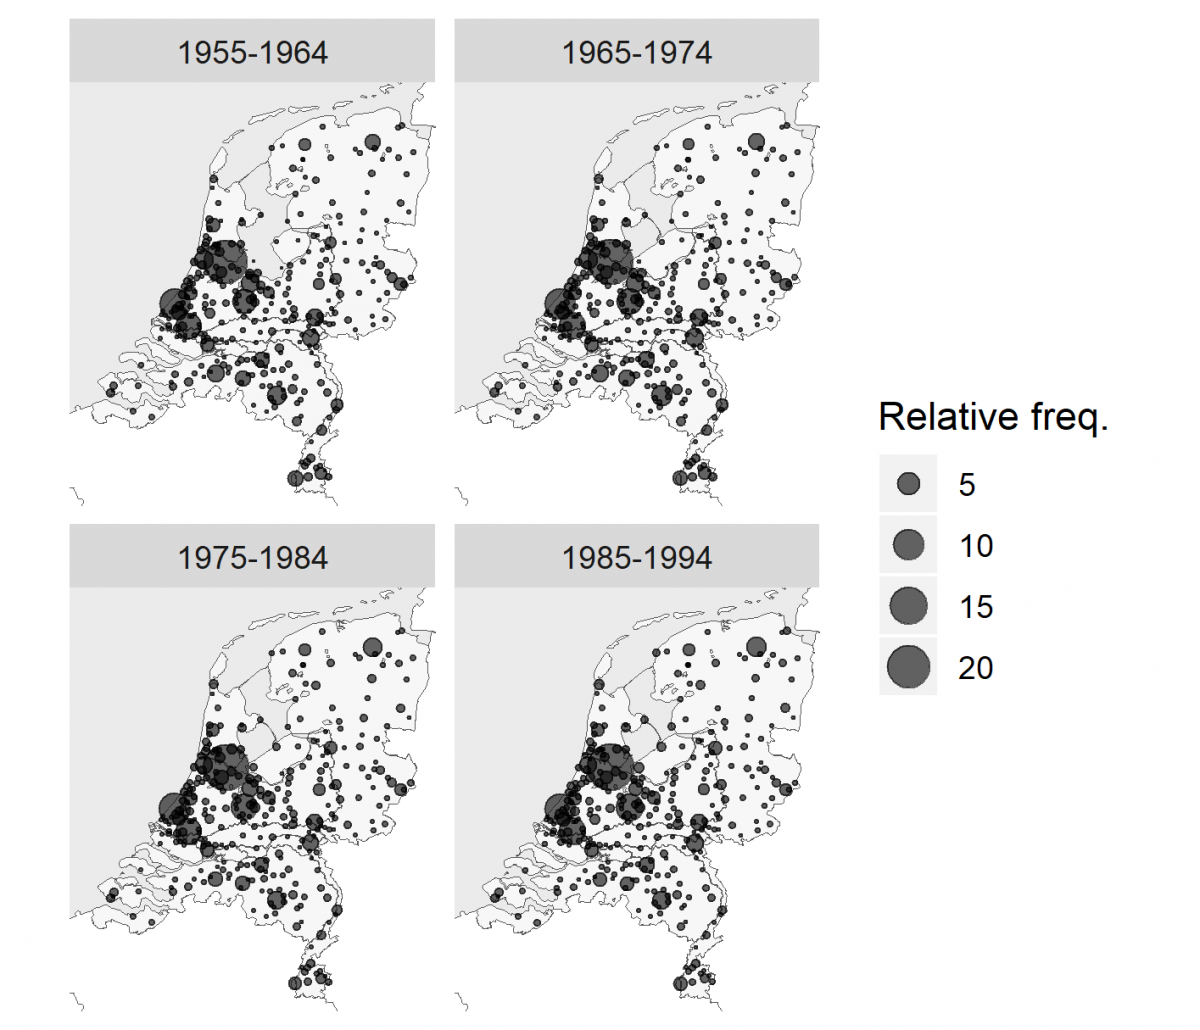
Figure 1 - Cities mentioned in De Volkskrant for the period 1960-1994
This first visualisation does not show a big shift in the geographical coverage of the newspapers. Unsurprisingly, the most mentioned cities are the 4 big cities of the Randstad: Amsterdam, The Hague, Rotterdam and Utrecht. The dynamics are more visible when looking at the change in relative coverage (see figure below).
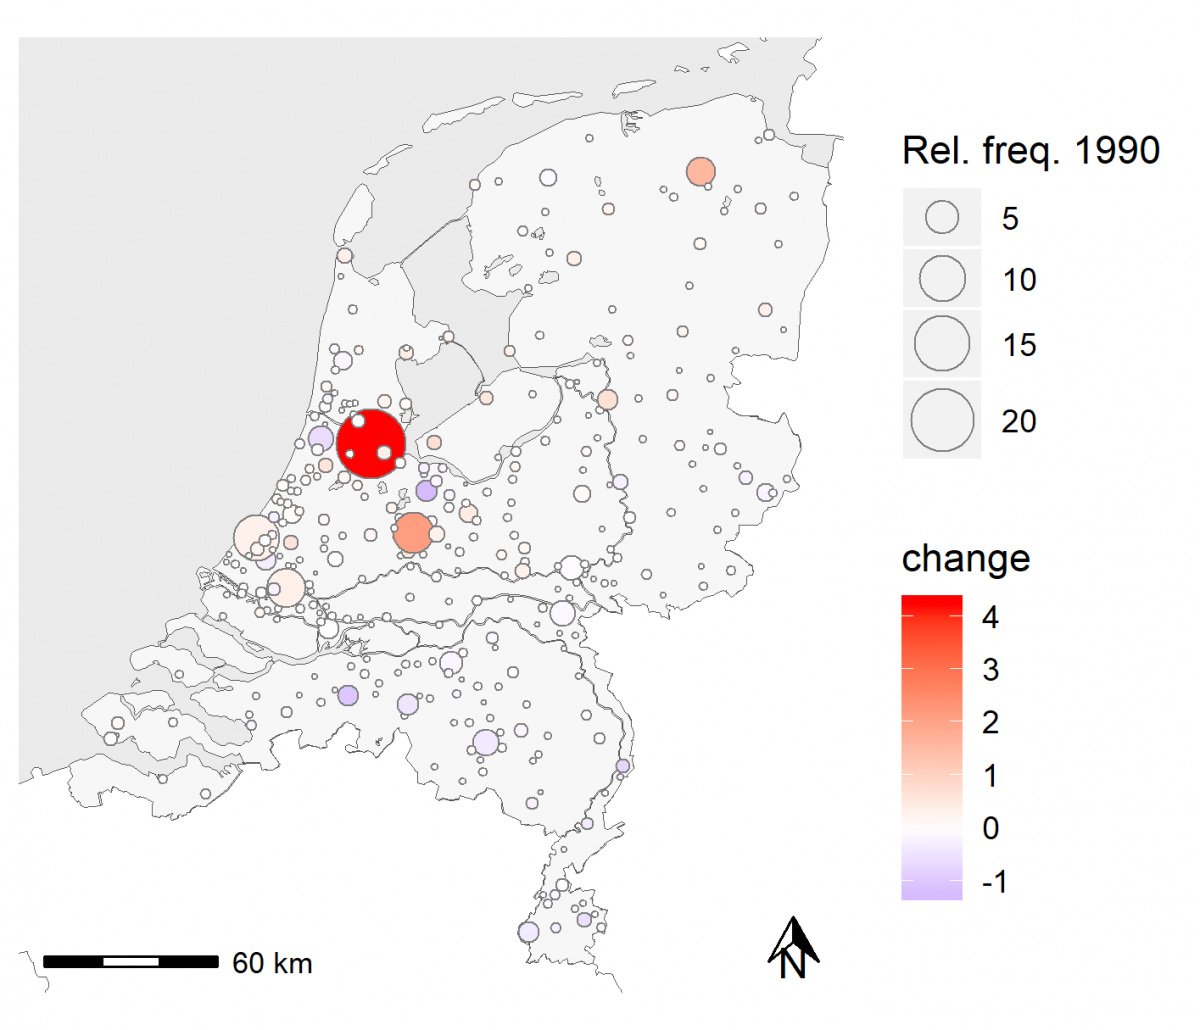
Figure 2 - Change in the relative coverage of Dutch cities in de Volkskrant 1960-1990
In the map of Figure 2, we can clearly see that Amsterdam, Utrecht and Groningen experienced the biggest increase in coverage, while Haarlem, Hilversum and the cities from North Brabant experienced the most important decrease. When looking at the top 10 increases and decreases over this period of time, some elements of the urban dynamics of the country in the second half of the 20th century can be seen very well (Table 1).
| CITY | CHANGE |
| Amsterdam | 4.25 |
| Utrecht | 2.15 |
| Groningen | 1.58 |
| Almere | 0.69 |
| Zwolle | 0.67 |
| Zoetermeer | 0.60 |
| Hoofddorp | 0.56 |
| Nieuwegein | 0.53 |
| Lelystad | 0.51 |
| Amstelveen | 0.46 |
Table 1 - Top 10 positive change in percentages points
Not surprisingly, one can see that cities that grew fast in this period also got covered more in De Volkskrant. It is only logical for instance that Almere and Lelystad, two towns created from scratch in the last generation of polders, got more mentions. Two other interesting cases are Nieuwegein and Zoetermeer, two growth centres (‘groeikernen’) that were developed because of the urgent need of housing for people in the area near respectively Utrecht and The Hague. Finally, Hoofddorp and Amstelveen were also fast growing cities over this period because of their proximity to Schiphol airport that experienced rapid development during this period.
Table 2 below gives the cities that got less media attention over time between 1960 and 1990.
| CITY | CHANGE |
| Hilversum | -1.23 |
| Breda | -1.01 |
| Venlo | -0.73 |
| Haarlem | -0.63 |
| Heerlen | -0.59 |
| Tilburg | -0.45 |
| Eindhoven | -0.37 |
| Roermond | -0.37 |
| Maastricht | -0.37 |
| Delft | -0.31 |
Table 2 - Top 10 negative change in percentages points
The decline in coverage of Hilversum relates perhaps to the fact that the names of radio stations and television became less connected to this city than before. The decline of the mention of cities in the south of the Netherlands is also apparent (e.g. Breda, Venlo, Heerlen, Tilburg, Eindhoven, Roermond and Maastricht), but less easy to explain. It may have to do with the change in focus of De Volkskrant, from being targeted at a Catholic audience in its early days to more a more general audience. The cities in the South all belong to the predominantly Catholic part of the Netherlands.
Geographical bias in reporting?
Of course, it may not be so surprising that the largest city Amsterdam gets covered most, and that the fast growing cities also gradually get more covered. Therefore, it makes sense to relate the relative frequency of city mentions to the size of these cities. To go deeper in the analysis of the coverage of Dutch cities by De Volkskrant, I formulated the hypothesis that media representation was a function of city size. I first tested this correlation for the period 1985-1994 and had very good results (≈0.9). I then used a linear model on log transformed variables to estimate the scaling law of this relation (also with data for the period 1985-1994). Scaling laws are often used in urban geography to evaluate how a variable changes with city size. They are based on the following relation:
y=aX^β
The scaling exponent β indicates the form of the relation. If β=1, the variable grows linearly with city size. If β<1, the variable grows sublinearly with city size and if β>1, the variable grows superlinearly with city size. In our case, the scaling exponent is equal to 1.38 (R²=0.65), indicating a superlinear regime. In normal words, it means that as cities get bigger, they are relatively more covered. Basically, a doubling of city (+100%) size leads to 138% more news coverage. When looking at the residuals of this model, one can clearly see an over-representation of the North of the Randstad while the South of the Randstad, and lots of southern and eastern cities are under-represented (Figure 4).
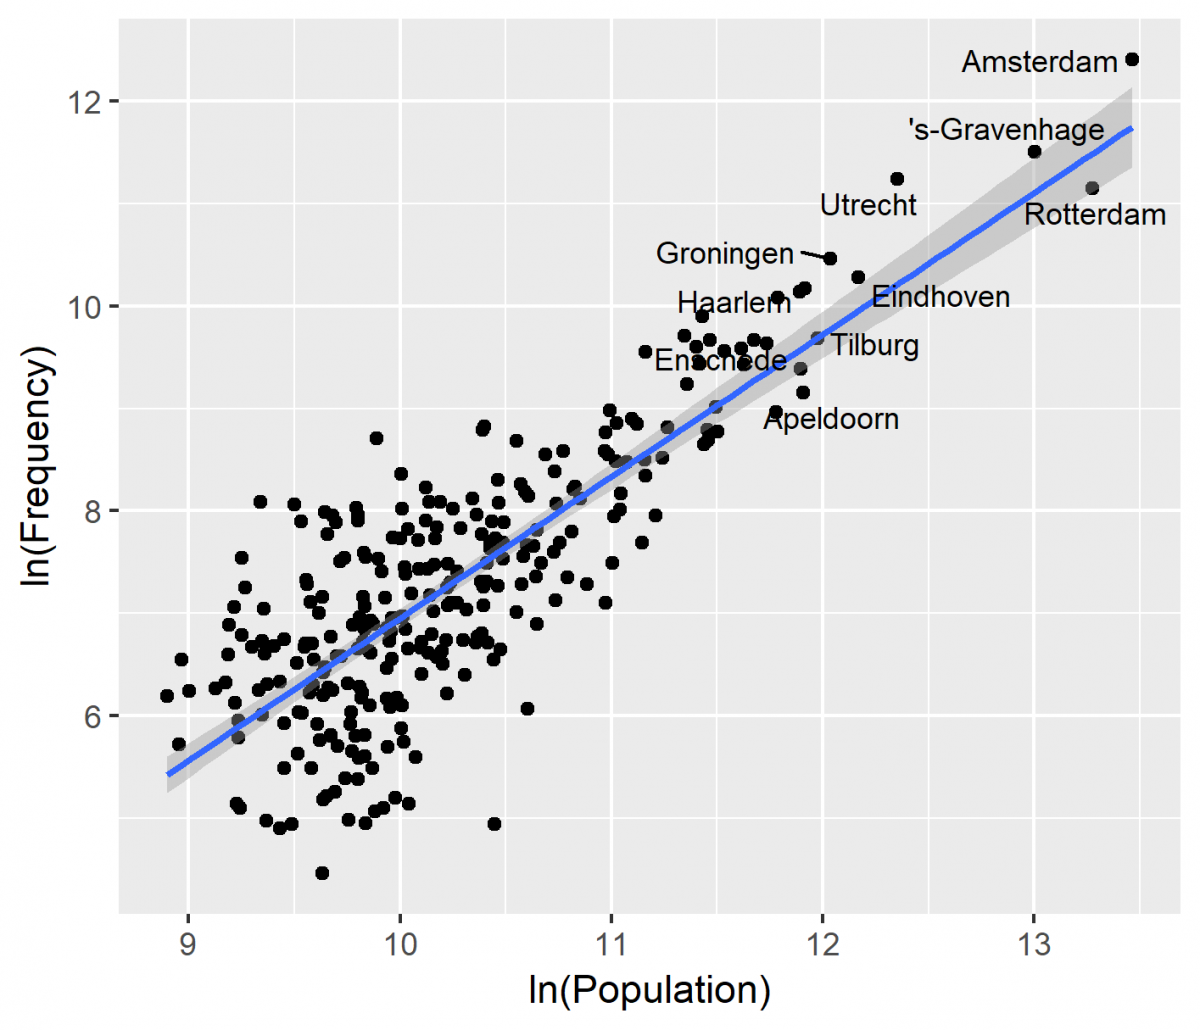
Figure 3 – Relation between media coverage and city size
Conclusion
In this blogpost, I have explored one of the potential uses of GeoNewsNL, a database to study the geographical dimension of Delpher. This was based on 1 newspaper out of the 81 newspapers that are contained in the dataset. This short analysis shows the interest of press data to study the urban dynamics of a county. I could also identify a significant spatial bias in the coverage of De Volkskrant in the 1990s, even though this newspapers claims to be nation-wide, with North Holland and Flevoland being overrepresented and the Southern wing of the Randstad being underrepresented, just like an important number of cities in particularly the South and the East of the country. At the same time, some places also in these regions are relatively overrepresented. But perhaps it is all just due to the fact that not much is happening in some places, and that others are more news-worthy. But to call Figure 4 a map of boring cities versus cities where ‘it’ is happening goes perhaps too far!
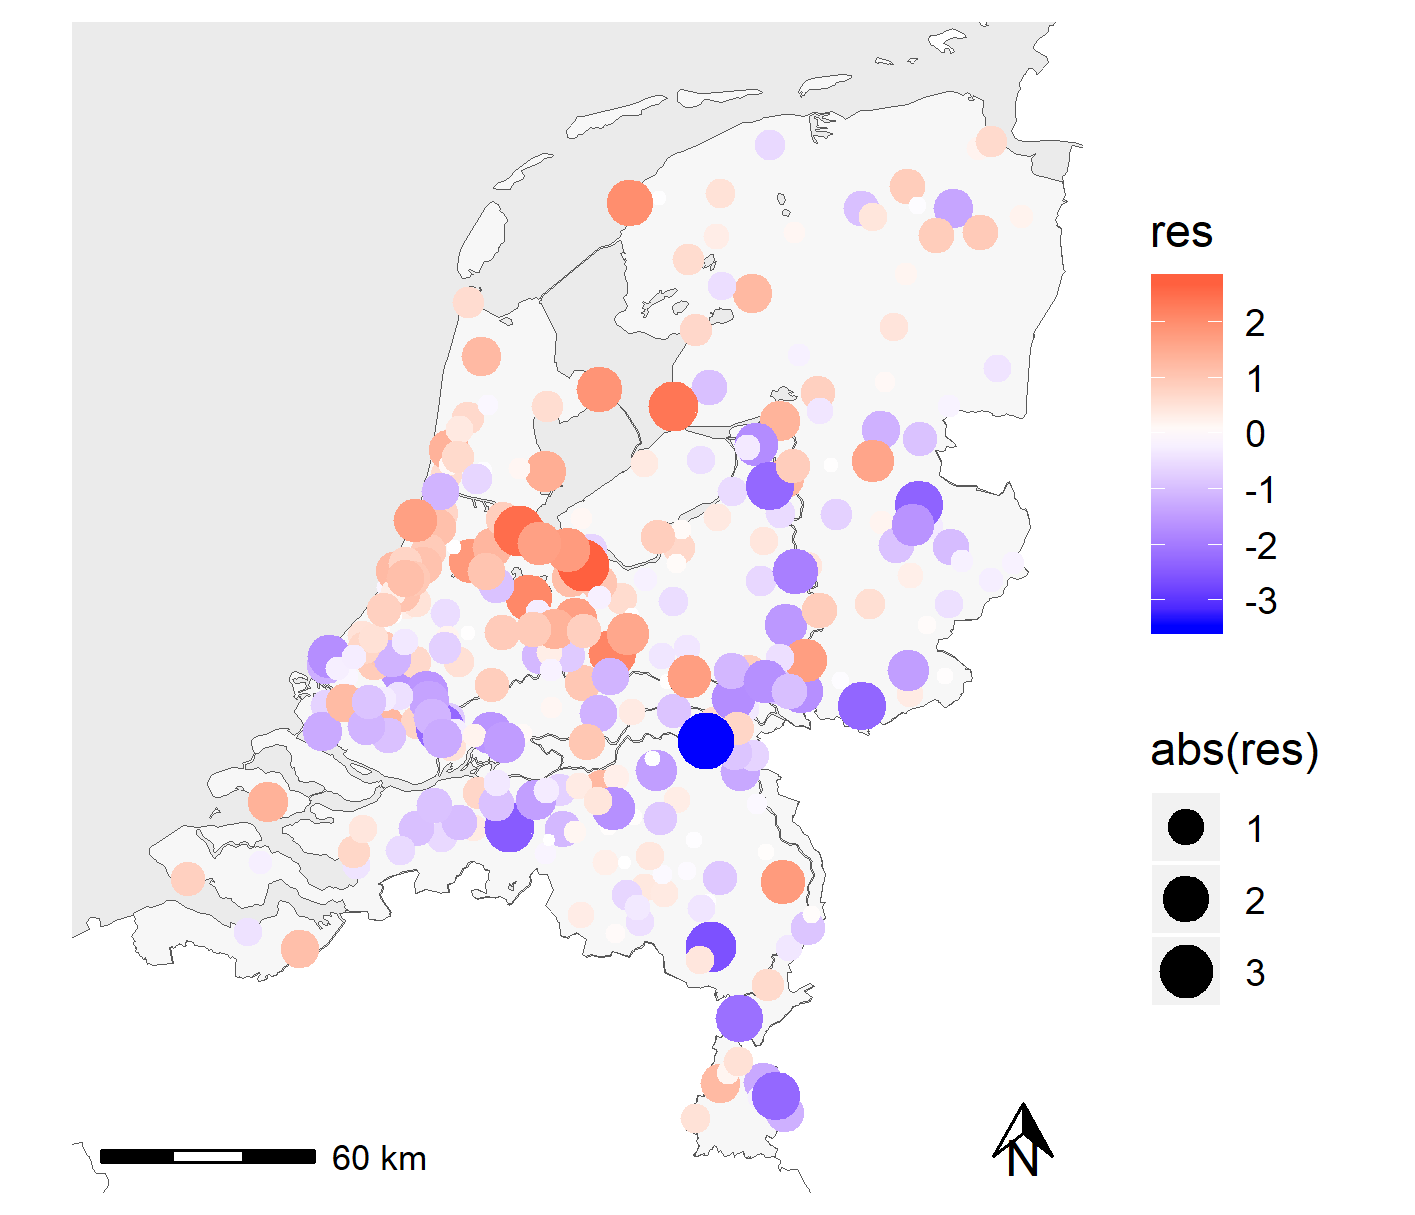
Figure 4 - Standardized residuals of the linear model