Introduction
Always wondered how many images are used in our historical newspapers? With this overview, you can see not only how many images there are, but also where they can be found within the dataset. Three graphs give you a quick insight into the use of images in newspapers from 1900 - 1994.
Please note! These graphs have been made for the Researcher-in-residence project of Martijn Kleppe and Desmond Elliott in the summer of 2015 and have not been updated after the latest addition to the newspaper dataset. All images have been collected in the KBK-1M dataset that was the output of their research.
When using the KB Newspaper image count, we request you to cite it as follows:
Faber, W.J., KB Newspaper Image Count (2015), KB Lab: The Hague http://lab.kb.nl/tool/kb-newspapers-image-count
Live demo
Instructions
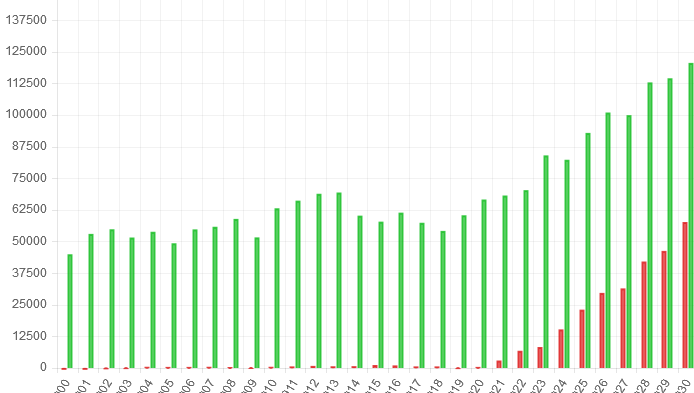
- The first graph shows you the amount of images in the newspapers from 1900 - 1994, set off to the amount of pages in total for that year,
- the second graph gives you the amount of pages that actually contain an image,
- the third graph sums the amount of pages next to the amount of issues for that year.
Hovering over a bar shows you the exact numbers, which can also be seen when downloading the CSV files that are available.