Sitting in the train to The Hague on the first day of my Researcher–in-residence project at the National Library of the Netherlands (KB), I thought about the time I first saw an image of train crash in a nineteenth-century illustrated newspaper. Having been interested in the Second World War and genocide for the most of my BA and MA, I decided I needed to take at least one course that focused on something entirely different. I chose a class on Nineteenth-Century periodicals because it seemed to be the furthest removed from my previous interest.
Trains in newspapers
Being a huge fan of trains and railways all my life, I can honestly say that seeing an illustration of elephants attacking a train in the Hollandsche Illustratie (see below) changed my life. I spent many hours looking for illustrations of train crashes in illustrated newspapers for an article in the Tijdschrift voor Tijdschrift Studies. I continued looking through these volumes for my PhD project, which focuses on the transnational trade in illustrations of the news and the production of identity by mid-nineteenth century European illustrated newspapers.
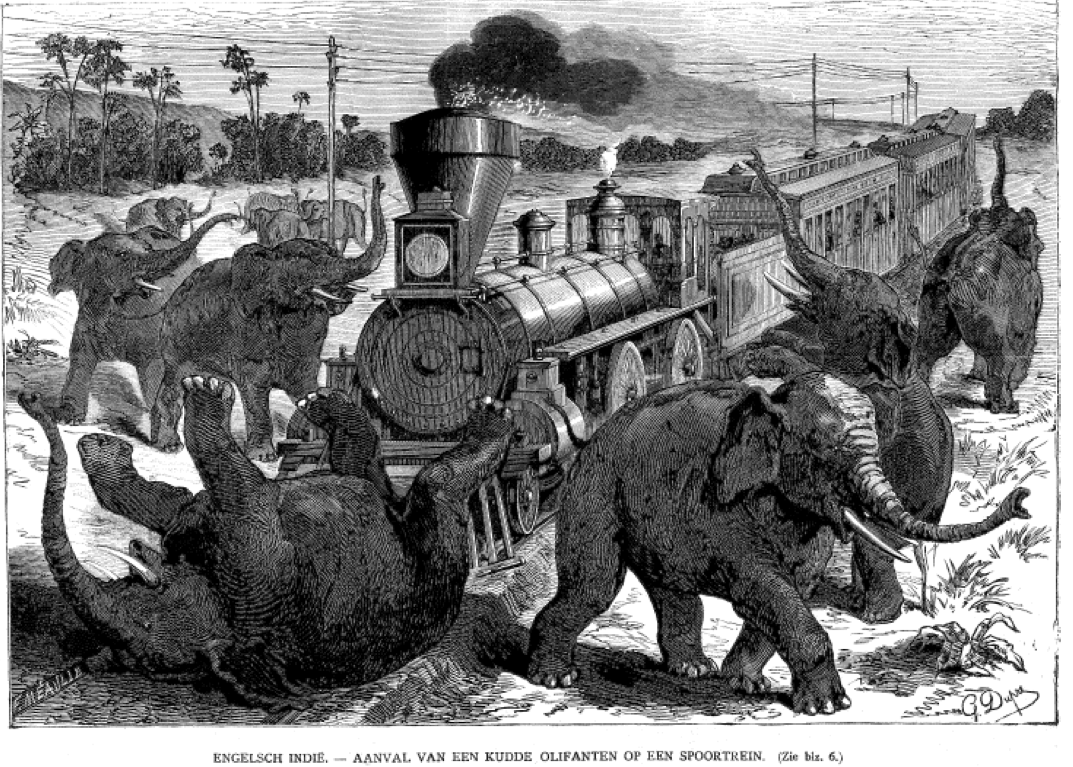
'A horde of elephants attacking a train’, De Hollandsche Illustratie, no. 12 (1867)
Sucked into my research
Doing research in illustrated newspapers is fascinating and tiresome at the same time. The images of nineteenth-century inventions, cities, and wars constantly distract you. I often forgot that I was looking for images of train crashes and frequently lost the small pieces of paper, marking interesting articles and illustrations. I started to wonder if it was possible to make this process easier: could computer vision help me find certain images in digitised (illustrated) newspapers? My current Researcher-in-residence project seeks to answer this question.
Images of the news: illustrations and photographs
The images of train crashes are part of the visualization of the news by illustrated newspapers. Contrarily to most teleological accounts of media history, which see the invention photography as the starting point of the truthful visualization of the news, several historians have suggested that around 1900 both illustrations and photographs were considered to be objective visual representations of news events. [1] However, relying on case studies, they have been unable to pinpoint and adequately describe this period. [2] My project will apply two computer vision techniques to sort the images of Dutch digitised newspapers, contained in the KBK-1M database, according to the way in which they were reproduced (engraving/half-tone). Hereby, it hopes to shed a new light on an important transitional phase in the history of the visual culture of the news
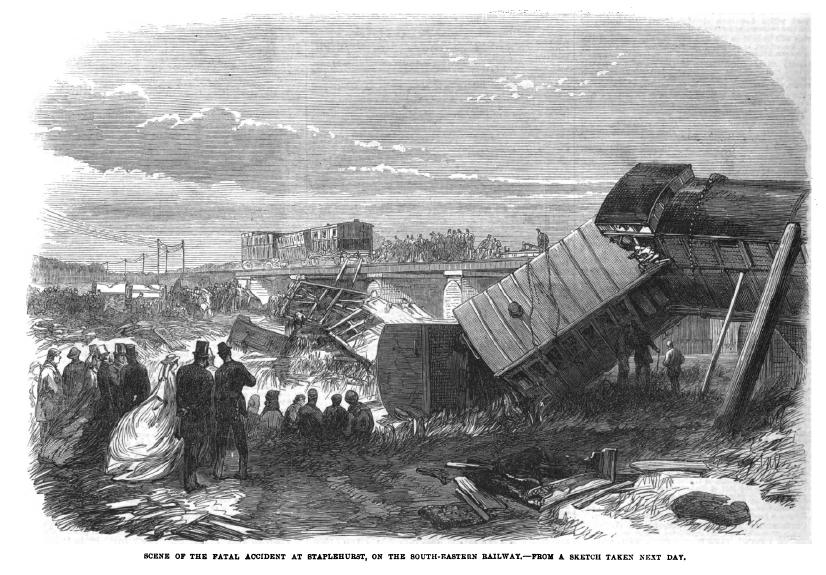
'Scene of the fatal accident at Staplehurst, on the South-Eastern Railway’, Illustrated London News (17 June 1865). After surviving this crash, which killed ten passengers and injured forty, the famous novelist Charles Dickens could not speak for two weeks, exhibiting signs of what we would call PTSD today.
Phase 1: Engravings vs half-tone
In the first phase of the project Willem Jan Faber, a research programmer at the KB, and I will apply a technique of a recent project of Paul Fyfe and Qian Ge (2016) to the images in the expanded KBK-1M database. Fyfe set out to study how computer vision and image processing techniques could be adapted for large-scale interpretation of British Victorian illustrated newspapers. [3] Ge devised a method to analyse two so-called low-level features of images: the pixel ratio, the number of low-intensity pixels divided by the total number of pixels, and the entropy level: the amount of information contained in the image. By juxtaposing these two features, they were able to sort the images of the illustrated newspapers according to the technique used for their reproduction. Half-tones, used to reproduce photographs, exhibit both a high pixel ratio and a high entropy level, while engravings, used to reproduce illustrations, display lower pixel ratios and entropy levels. [4]
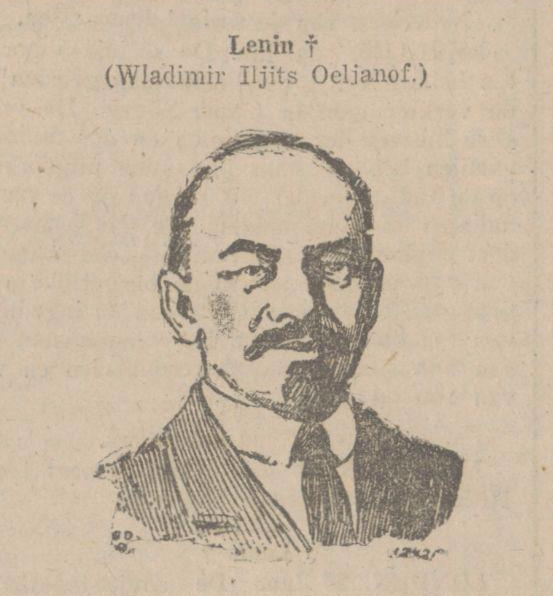
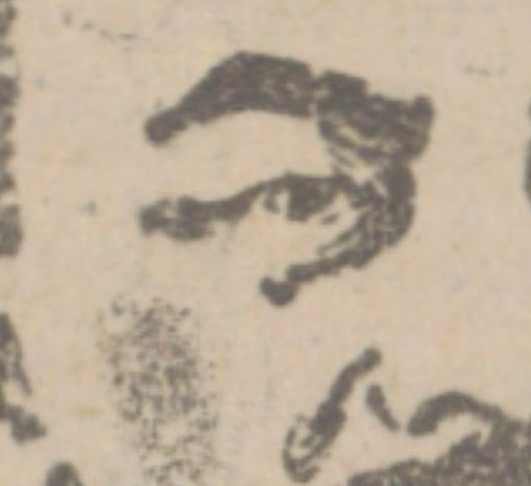
Photograph of Lenin, reproduced using halftone. ‘Lenin’, Nieuwe Apeldoornsche courant (23-01-1921). Detail of Lenin’s portrait showing engraving pixel pattern.
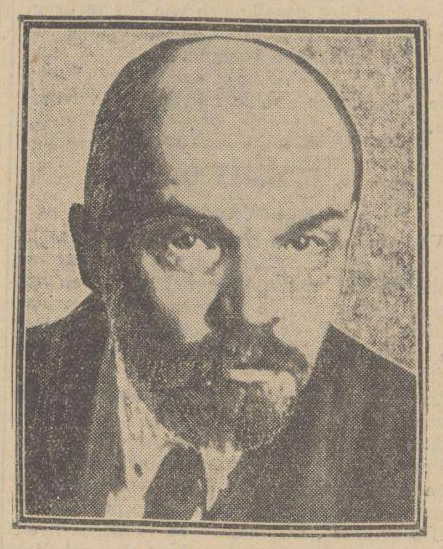
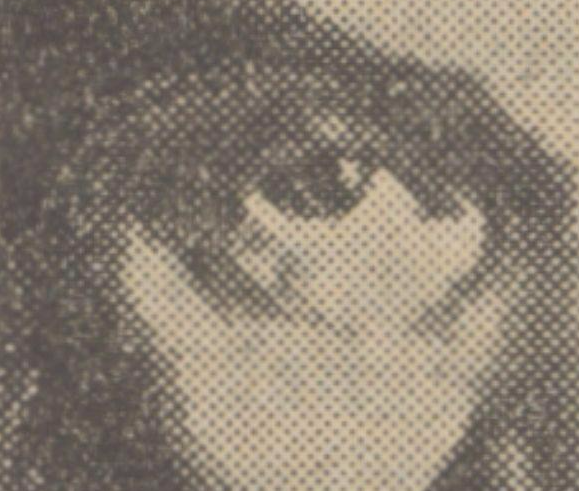
Photograph of Lenin, reproduced using halftone. ‘Lenin’, Nieuwe Apeldoornsche courant (23-01-1921). Detail of Lenin’s photograph showing typical halftone pixel pattern.
Phase 2: Recognise categories
The second phase of the project explores how (a combination of) two open source computer vision applications (OpenCV/Caffe) can be used to further fine-tune the recognition of engravings and photographs and subdivide them into different categories. For example, while we expect that illustrations of the news, caricatures, maps, chess problems, and weather forecasts will all be classified as engravings by the technique of Fyfe and Ge, image similarity algorithms, available in OpenCV and Caffe, might be able to subdivide these images into specific categories.
Application of the enriched set
If successful, this subdivision into categories could help to answer all sort of (media) historical questions. For example, when did newspapers start to publish political caricatures on a large scale? Or how did they use maps to visually represent the world in general, or specific news events, such as wars? Second, the techniques used by this project could also be used to add all sorts of metadata to the collections of the KB, potentially making it possible to search for the category ‘caricature’ in Delpher in the future.
How does an algorithm look at a train crash?
While computer vision is able to detect faces and objects in photographs, I’m doubtful if it can help me find images of train accidents in the digitised newspapers of the KB. The algorithms of OpenCV and Caffe are mostly geared to high-definition digital images, which causes them “misread” both the low-quality reproductions of photographs and illustrations in the late-nineteenth and early twentieth century press. While our eyes easily see the similarities between an illustration and a photograph of a train, algorithms “see” something entirely different. However, I hope that my project will be a step in the right direction.
I hope to finish my project at the end of October and I will present some preliminary results in August at the Digital Humanities 2017 conference in Montreal.
[1] See: Hill, J., & Schwartz, V. (2015). General Introduction. In J. Hill & V. Schwartz (Eds.), Getting the Picture: The Visual Culture of the News (pp. 1-11). London: Bloomsburry Academic; Keller, U. (2013). The Ultimate Spectacle: A Visual History of the Crimean War. London: Routledge; Barnhurst, K. Nerone, J. (2000). Civic Picturing vs. Realist Photojournalism. The Regime of Illustrated News, 1856-1901, Design Issues 16(1), 59-79.
[2] Gervais, T. (2010). Witness to War: The Uses of Photography in the Illustrated Press, 1855-1904. Journal of Visual Culture, 9(3), 370-384. doi:10.1177/1470412910380343; Park, D. (1999). Picturing the War: Visual Genres in Civil War News. The Communication Review, 3(4), 287-321. doi:10.1080/10714429909368588; Steinsieck, A. (2006). Ein imperialistischer Medienkrieg. Kriegsbenchterstattung im Sudafrikanischen Krieg (1899-1902). In U. Daniel (Ed.), Augenzeugen. Kriegsberichterstattung vom 18. zum 21. Jahrhundert (pp. 87-112). Göttingen: Vandenhoeck & Ruprecht.
[3] Fyfe, P. (2016). Illustrated Image Analytics. How Computers See Illustrated Victorian Periodicals [Powerpoint slide]. Retrieved from https://ncsu-las.org/wp-content/uploads/2016/05/wrm-presentation-slides…
[4] Ge, Q. (2016) Computer Vision Techniques for Analysis of Illustrations in 19th Century British Newspapers [Powerpoint slide]. Retrieved from https://ncsu-las.org/wp-content/uploads/2016/05/wrm-presentation-slides…